

ThermoCal
LiveThermoelectric assembly without inventing κ
A thermoelectric quantity is defined where it was measured. Linear extrapolation past the last laser-flash temperature is a claim about physics that nobody made.
Seebeck, resistivity and thermal conductivity still arrive as three files, three temperature grids, and a zT that was finished in Excel. The last κ point is 773 K; S and ρ run to 850 K; a dashed zT is drawn anyway. Two hours of Origin styling per panel is treated as analysis.
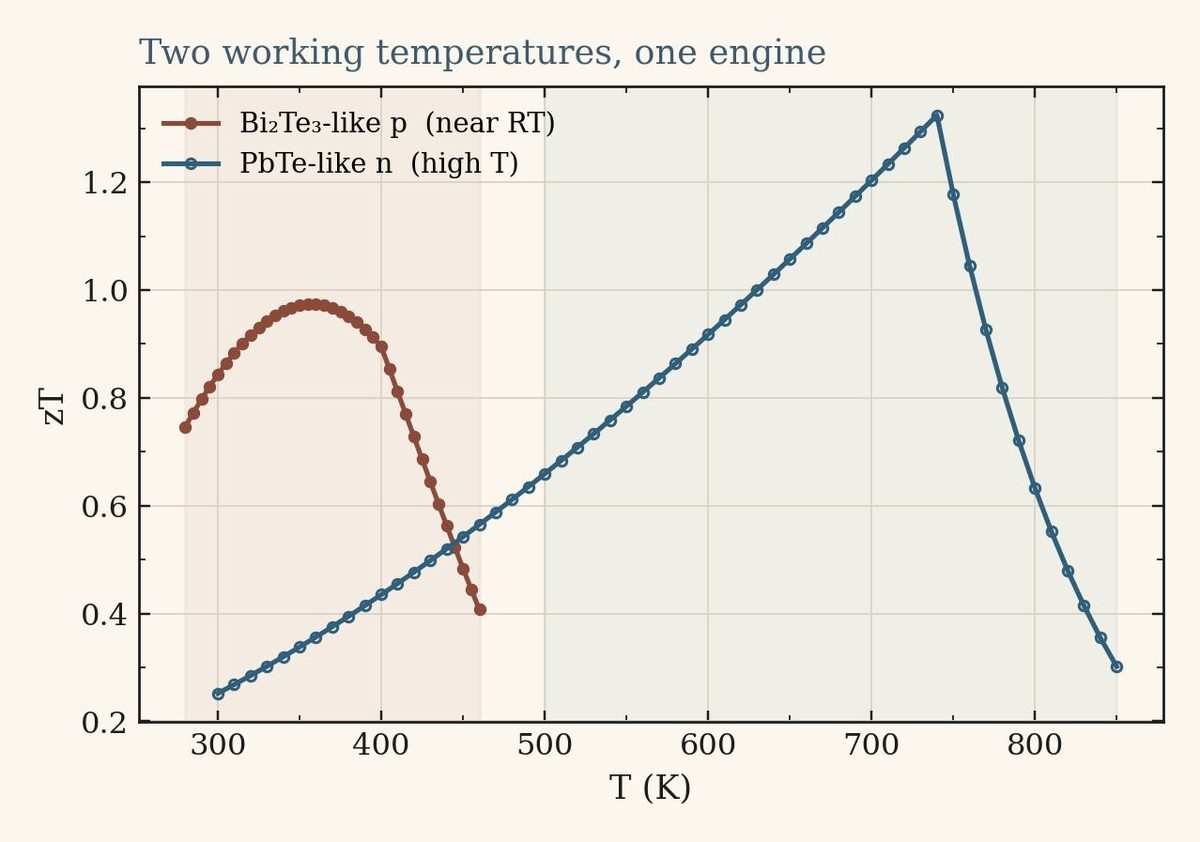
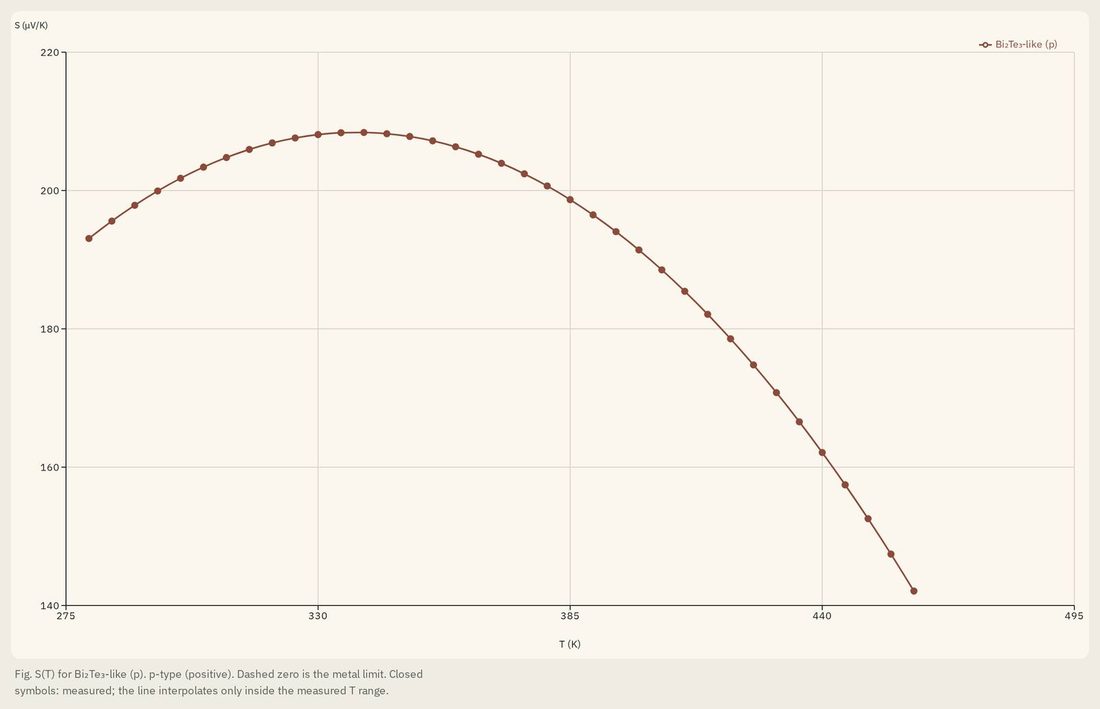
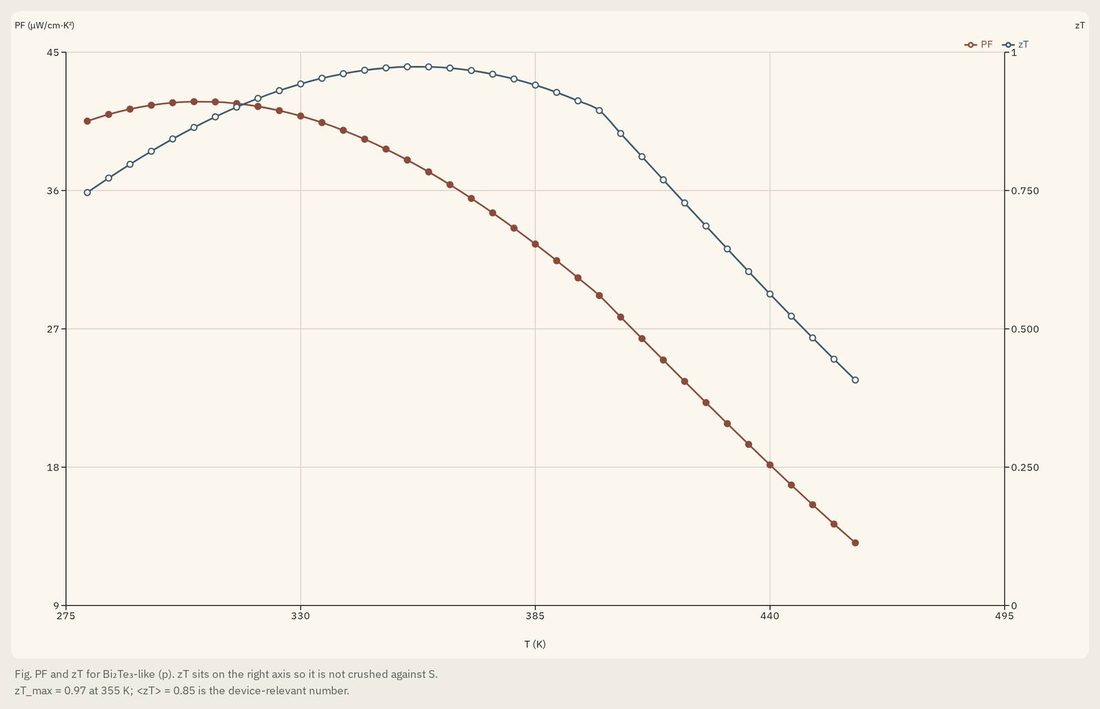
ThermoCal treats assembly as an instrument. It builds the T-grid on the overlap of the loaded series. If κ stops at 773 K, zT stops at 773 K. The PF–zT tab will show a power factor without a zT until κ arrives. A dashed zT is not drawn. Provenance sits on every cell: measured, interpolated onto the grid, or absent. Lorenz and Th/Tc corrections are explicit, not tribal knowledge.
What it does
- No extrapolation, on principle — zT lives only on the overlap of S, ρ and κ
- Provenance on every assembled cell; the worksheet is live, not an export
- Lorenz number and Thomson/Peltier bookkeeping stated rather than assumed
- Origin-style paper plots: margins, dual axes, closed/open symbols, captions
- One .thermocal.json holds geometry, files, view and corrections